Figure 3.

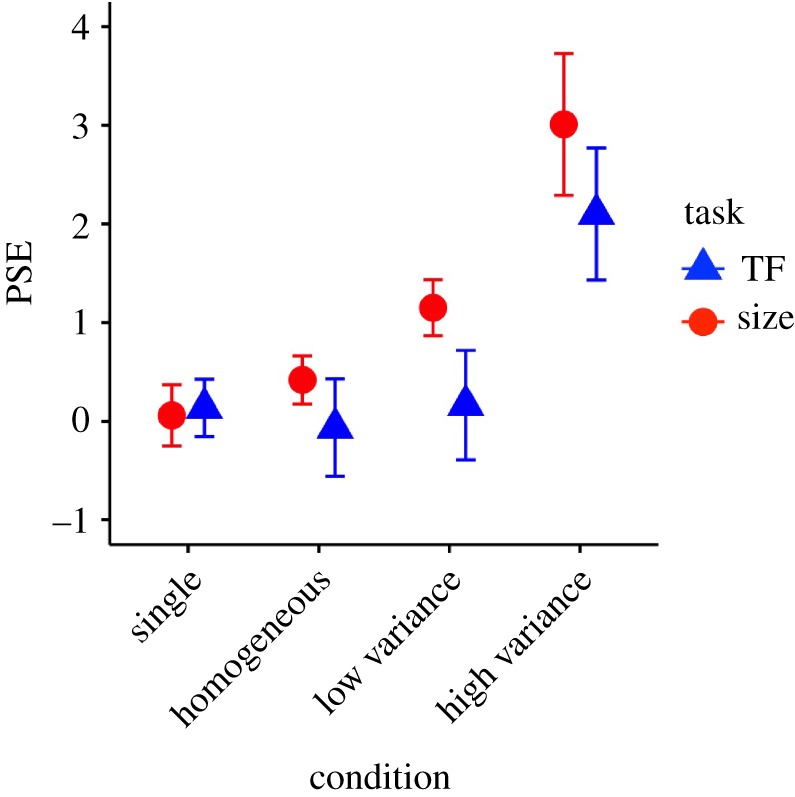
Averaged PSEs of the psychometric functions fitted to data of each individual participant in experiment 2. Error bars represent standard errors. (Online version in colour.)

Averaged PSEs of the psychometric functions fitted to data of each individual participant in experiment 2. Error bars represent standard errors. (Online version in colour.)