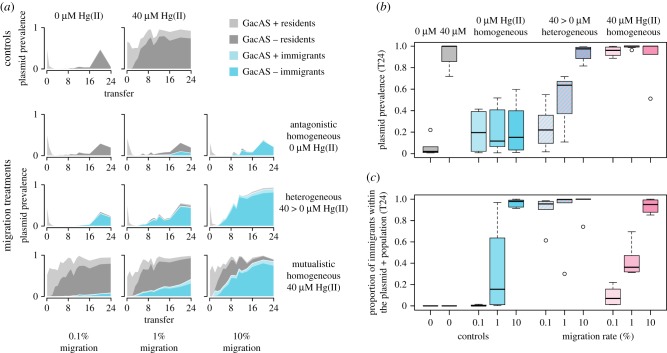
Figure 2.
The impacts of migration across treatments. (a) Population dynamics within plasmid-containing individuals over the course of the selection experiment. The total shaded area shows the proportion of plasmid containing individuals in the focal subpopulations, averaged across six replicate populations. Shading is broken down by genotype, showing the relative proportion of resident (grey) and immigrant (blue) bacteria which were positive (light) or negative (dark) for the GacA/S phenotype (i.e. dark areas indicate compensatory mutations). (b) Summary of endpoint (transfer 24) mean plasmid prevalence (n = 6). (c) Mean proportion of plasmid containing individuals that are from the source population (lacZ+) at the final time point (n = 6).

