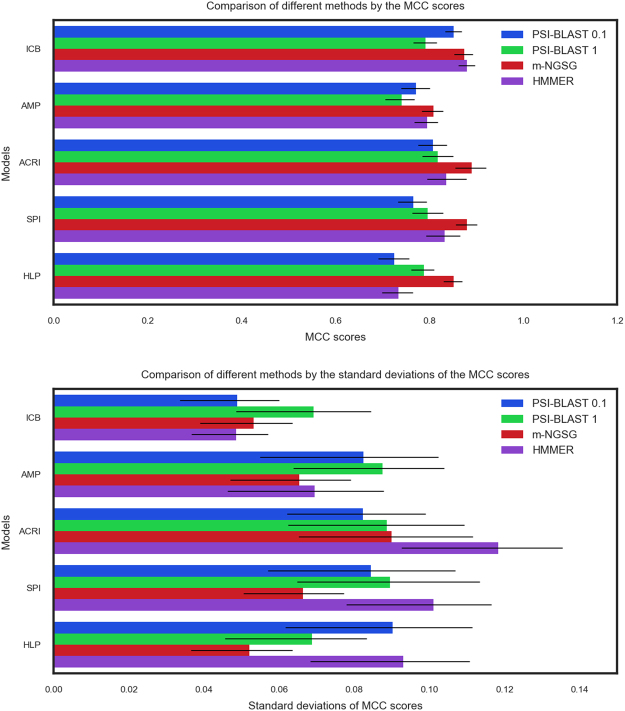
Figure 3.
The depth of performance-consistency for each model. (A) (upper panel) illustrates the comparison of MCC (Mathews Correlation Coefficients) among PSI-BLAST (E-value 0.1 and 1), m-NGSG, and HMMER. The Y-axis indicates different function-based models; the X-axis indicates the MCC values with their standard errors. Each bar plot depicts the method used to build the models. (B) (lower panel) illustrates the comparison of standard deviations of MCC (Mathews Correlation Coefficients) scores among PSI-BLAST (E-value 0.1 and 1), m-NGSG, and HMMER. The Y-axis indicates different function-based models; the X-axis indicates the standard deviations of the MCC values with their standard errors. Each bar plot depicts the method used to build the models. Here, the higher the standard deviation, the lower the performance-consistency. The m-NGSG-based models show standard deviations of MCC values lower than 0.05 for each model while HMMER and PSI-BLAST return high standard deviations on some models. Please see Supplement Figs S2 and S3 for more details.

