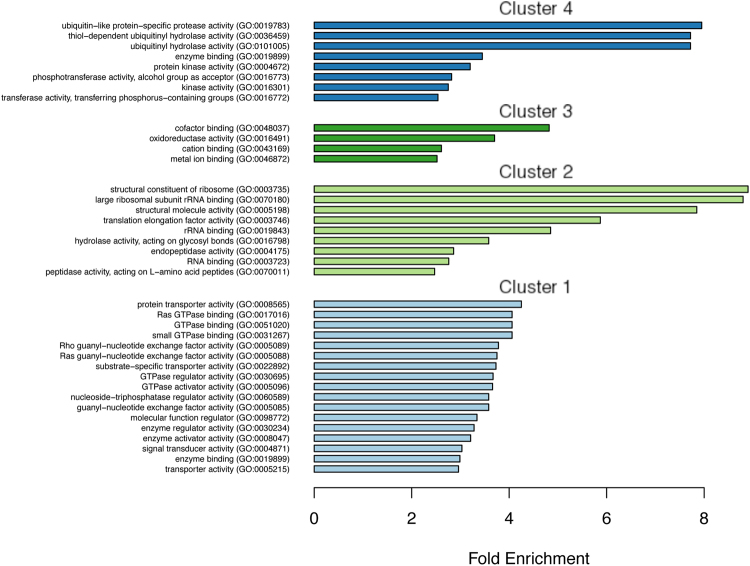
Figure 4.
GO term enrichment in the clusters from C10. In cluster 1, the genes that had been downregulated by OS appeared to have normal expression levels in the presence of LB. In cluster 2, the genes that had been upregulated by OS appeared to have normal expression levels in the presence of LB. In cluster 3, the genes were upregulated by OS and downregulated in the presence of LB. In cluster 4, the genes were downregulated by OS and upregulated in the presence of LB. PANTHER tools (http://pantherdb.org/) were used to test the GO term enrichment in gene sets, relative to the background list of all the genes in the amoeba genome. The GO terms were used to identify enriched molecular processes; those with an FE ≥ 2.5 were plotted. A summary for gene ontology (GO) term analysis is provided in Tables 2 and S5.

