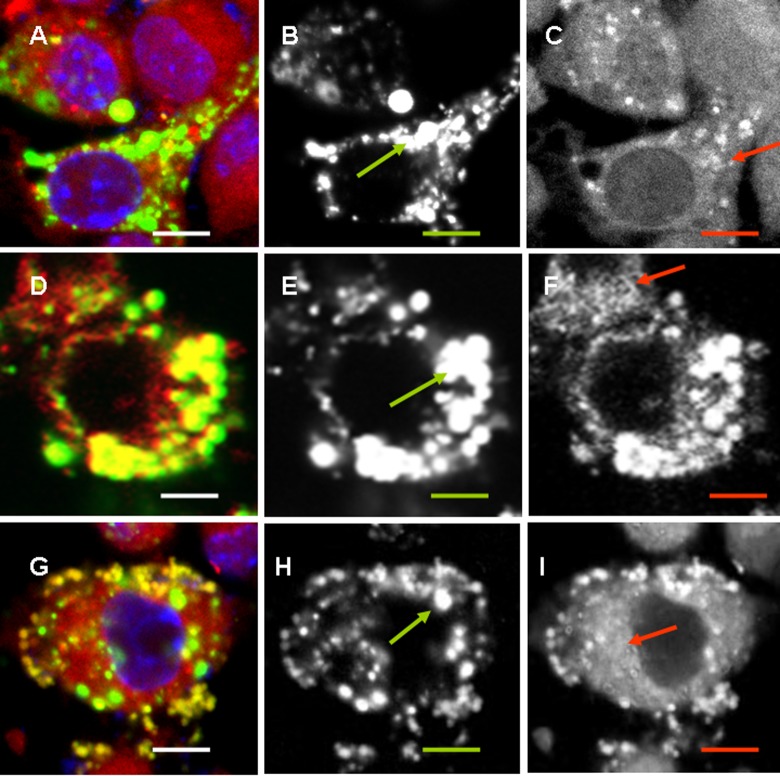
Figure 6.
Colocalization of negatively charged NPs with endoplasmic reticulum. RAW264.7 cells were incubated with 50 µg/ml of FITC-labeled LS-NPs (a to c), LSG-NPs (d to f), or LSD-NPs (g to i) (green) for 24 h; EPR tracker was added for the last hour. Overlaid, green and red images are shown from left to right. Scale bar corresponds to 5 µm. Vesicular structures are shown with green arrow and EPR cisternae structures are shown with red arrows. (See Figure 1 legend and Table 1 for the abbreviations).

