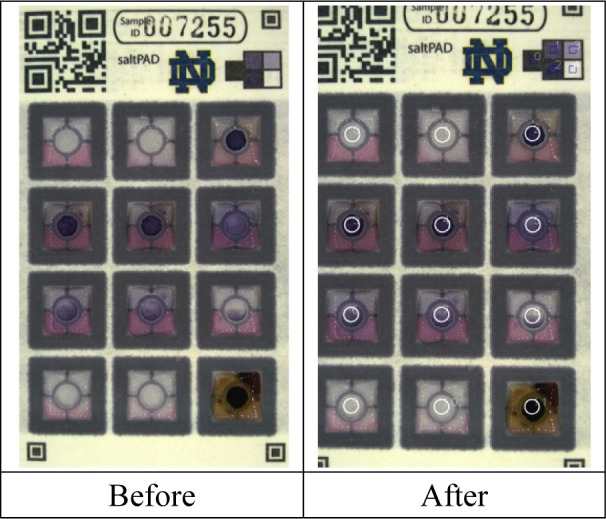
Figure 5.

Automated software analysis images of the saltPAD. Before) A picture of a saltPAD taken with a cell phone. After) The input image is analysed by the program, which locates the regions of interest designated by the white circles. These coincide with the indicator spots. The greyscale intensity is measured, fitted to calibration curves stored in the program memory, and the resulting iodine concentration is reported to the user.
