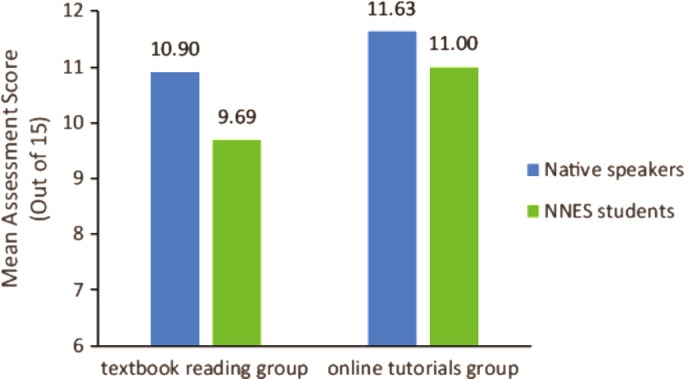
FIGURE 4.

Mean scores for science process skills assessment among native and nonnative English speakers. Comparison highlights the difference between the two groups when given textbook reading or online tutorials. While larger gaps were observed for NNES students in the textbook reading group, statistical power was not sufficient to make a definitive conclusion due to the small number of NNES students enrolled in the study courses.
