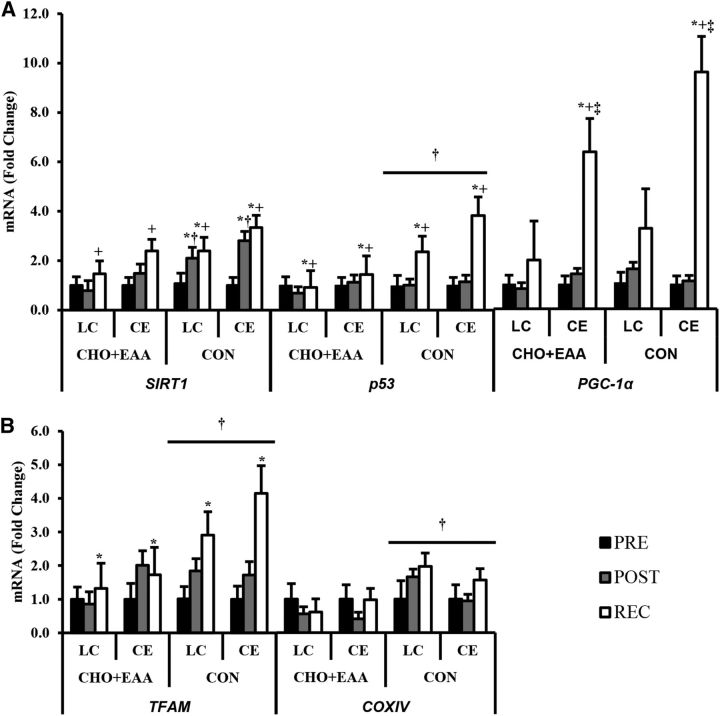
FIGURE 3.
mRNA expressions of SIRT1, PGC-1α, and p53 (A) and TFAM and COXIV (B). Data are presented as fold changes relative to mean pre-exercise values for each group. Values are means ± SEMs. *Different from pre-exercise, P < 0.05. +Different from postexercise, P < 0.05. ‡Different from LC, P < 0.05. †Different from CHO+EAA, P < 0.05. CE, cycle ergometry; CHO+EAA, carbohydrate plus essential amino acids; CON, control; COXIV, cytochrome c oxidase subunit IV; LC, load carriage; PGC-1α, peroxisome proliferator-activated γ-receptor coactivator 1α POST, postexercise; PRE, pre-exercise; p53, tumor suppressor p53; REC, recovery; SIRT1, sirtuin 1; TFAM, mitochondrial transcription factor A.

