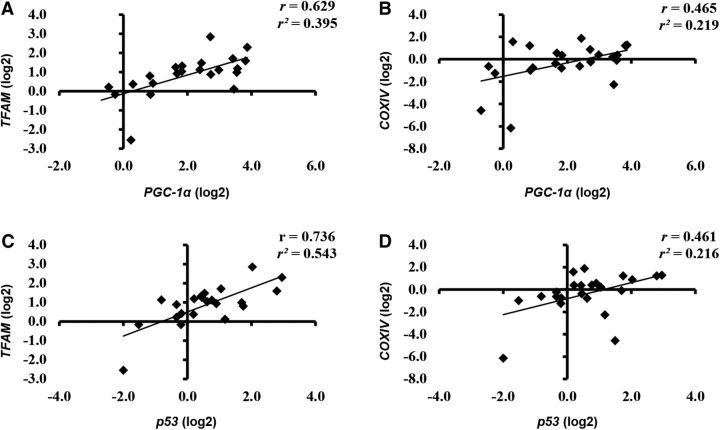
FIGURE 4.
Correlation of PGC-1α to TFAM (A) and COXIV (B) expression and of p53 to TFAM (C) and COXIV (D) expression. Data are reported as log2 values for correlations to maintain equal scale between positive and negative values. COXIV, cytochrome c oxidase subunit IV; PGC-1α, peroxisome proliferator-activated γ-receptor coactivator 1α p53, tumor suppressor p53; TFAM, mitochondrial transcription factor A.

