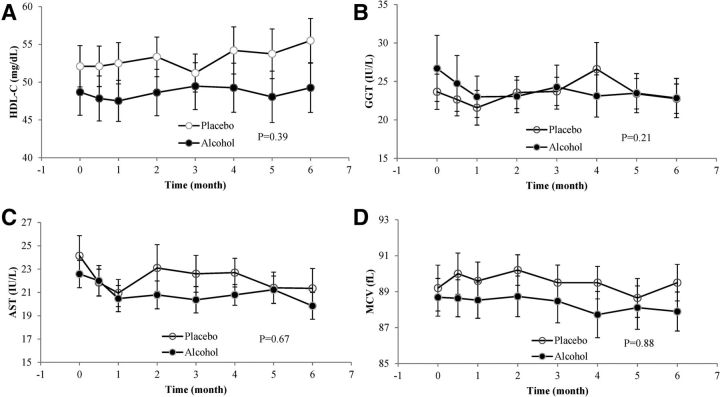
FIGURE 2.
Biomarker concentrations of HDL-C (A), GGT (B), AST (C), and MCV (D) among participants assigned to alcohol or the control beverage at all measured time points. Values are means ± SEs. P values represent the difference in linear time trends between groups from mixed models, adjusted for baseline differences in smoking, platelet count, glycated hemoglobin, and depressive symptoms. AST, aspartate aminotransferase; GGT, γ-glutamyltransferase; HDL-C, HDL cholesterol; MCV, mean corpuscular volume.

