
FIGURE 3.
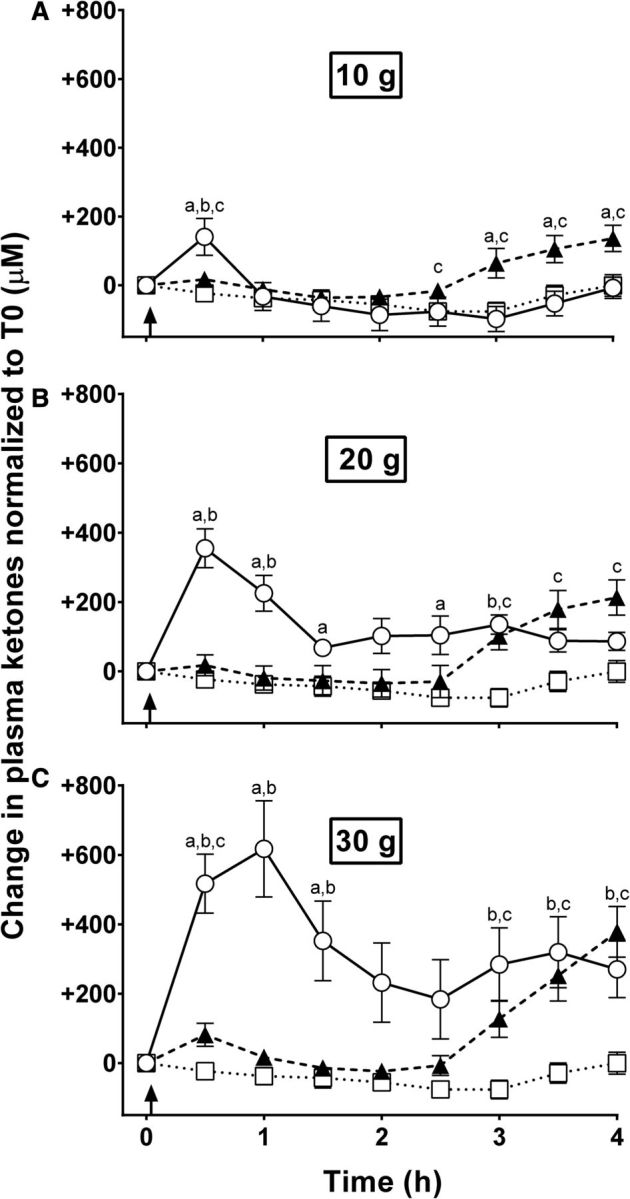
Changes in plasma ketones normalized to T0 during CTL (□ dotted lines) or metabolic tests with 10-g (A), 20-g (B), and 30-g (C) doses of MCT-NEs (▴ dashed lines) or MCT-Es (○ solid lines). aMCT-Es compared with MCT-NEs, bMCT-Es compared with CTL, cMCT-NEs compared with CTL (all P < 0.05). CTL, no-treatment control; MCT-E, emulsified medium-chain TG; MCT-NE, nonemulsified medium-chain TG; T0, time 0; ↑, medium-chain TGs consumed.