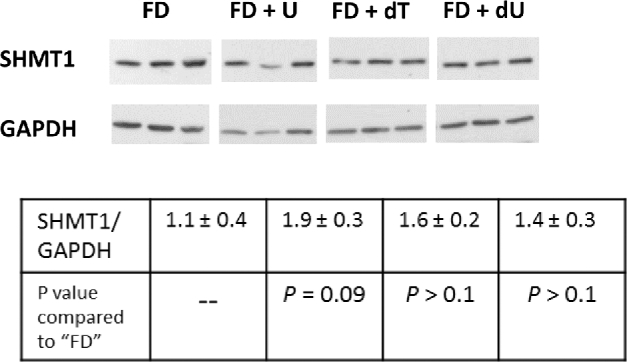
FIGURE 5.

SHMT1 expression in the colon does not differ among nucleoside-containing diets. Protein expression concentrations vary longitudinally along the colon and in tumor tissue; therefore, sections from the middle one-third of the colon and free of tumors (n = 3/group free of tumors) were removed and proteins were extracted. Proteins were separated on a 10% SDS-PAGE gel, then transferred to a polyvinylidene difluoride membrane for Western blot analysis. Densitometry was performed by using ImageJ software, and the intensity of the SHMT1 protein band was normalized to the intensity of GAPDH for each sample. Values are means ± SDs, n = 3 samples/group. Significance was determined by using a Student's t test with a Bonferroni correction for multiple comparisons. There were no differences among SHMT1 expression in colons of mice fed the FD AIN-93G-based control diet and the mice fed any of the nucleoside-containing diets. dT, thymidine; dU, deoxyuridine; FD, folate-deficient; SHMT, serine hydroxymethyltransferase; U, uridine.
