Figure 1.
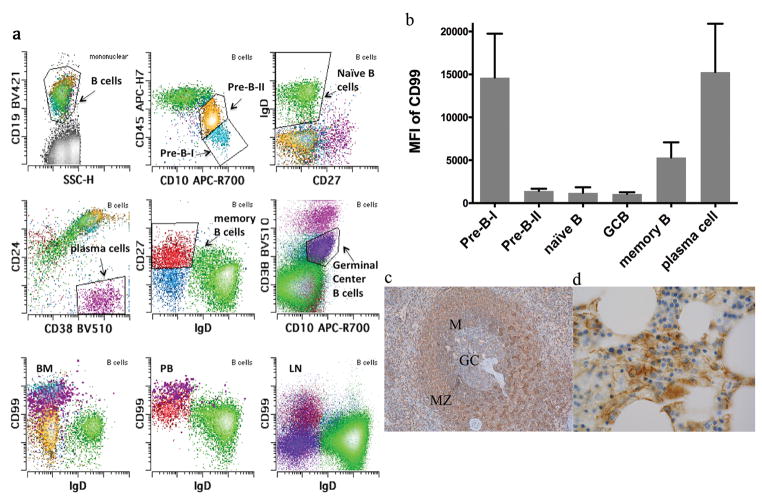
A. Representative example of CD99 expression through B cell maturation in bone marrow, blood and lymph node. Early (pre B–I) hematogones (light blue) show high expression, while late (pre-B-II)(yellow), naïve B (green), and germinal center (GC)-B cells (dark purple) show dim to negative expression. The expression is regained on memory B cells (red) and is further increased on plasma cells (purple, emphasized for clarity in selected panels).
B. Summary of CD99 expression (mean fluorescence intensity) in pre-B-I, pre-B-II, naïve B, GCB, memory B and plasma cells is shown.
C. Representative example of CD99 immunohistochemistry staining in normal spleen is shown. Mantle cell (M) composed predominantly of naïve B cells and germinal centers show low level staining, while marginal zones (MZ) composed of memory B cells show increased staining (200X).
D. Representative example of CD99 immunohistochemistry staining in reactive polyclonal plasmacytosis. CD99 stains reactive plasma cells (1000X).

