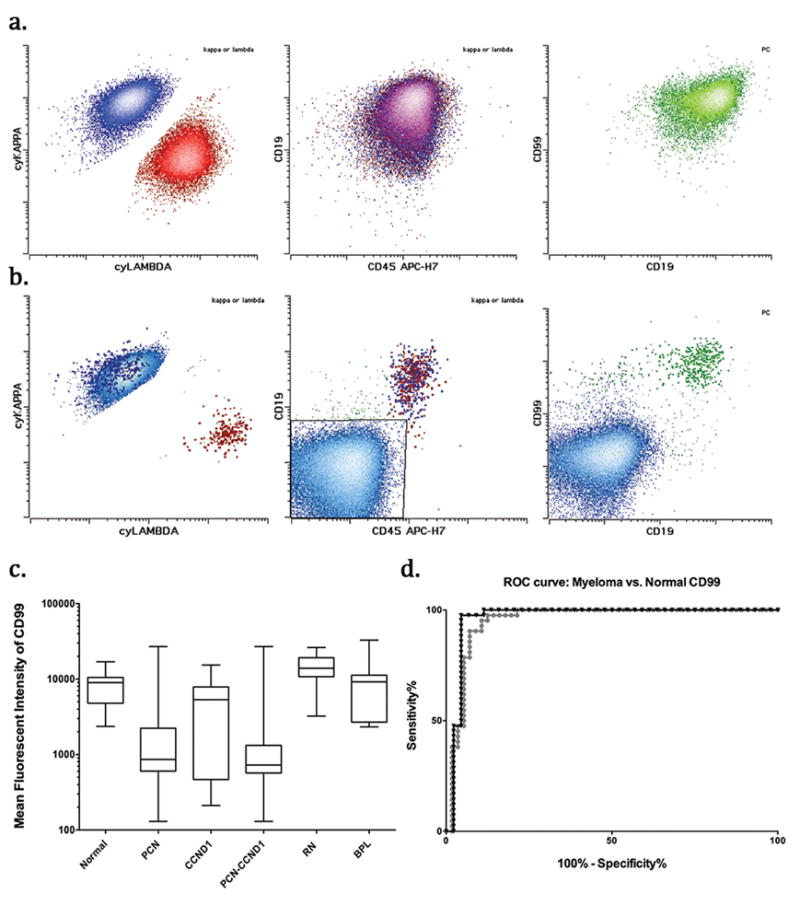
Figure 2.

A. Representative example of normal CD99 expression in reactive bone marrow plasma cells is shown. Normal plasma cells gated from tube 1 (kappa expression-blue, lambda expression-red) and from tube 2 (green) show high CD99 expression.
B. Representative example of neoplastic plasma cells (light blue) show markedly reduced to absent CD99 expression. In contrast residual normal plasma cells (emphasized) show bright CD99 expression.
C. Summary of CD99 expression (mean fluorescence intensity) in normal plasma cells, neoplastic (PCN), PCNs with CCND1 translocation (CCND1), without CCND1 translocation (PCN-CCND1), residual normal (RN) plasma cells in samples from patients with PCN, and in B cell lymphoma with plasmacytic differentiation (BPL) is shown.
D. Receiver-operator characteristic curve curves for myeloma vs. normal plasma cells are shown for all neoplastic samples (circles) and those without CCND1 translocation (triangles)
