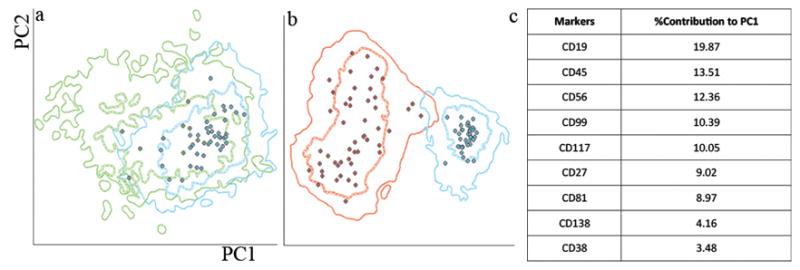
Figure 3.

A. Principal component analysis was performed to compare residual normal plasma cells (blue density plots, means indicated by blue circles) in patients with myeloma and plasma cell from reactive marrows (green). No separation was observed.
B. Principal component analysis was performed to compare normal plasma cells (blue density plots, means indicated by blue circles) and neoplastic plasma cells. Full separation could be seen using principal component one component alone
C. Relative (percentage) contributions to principal component one separation are listed.
