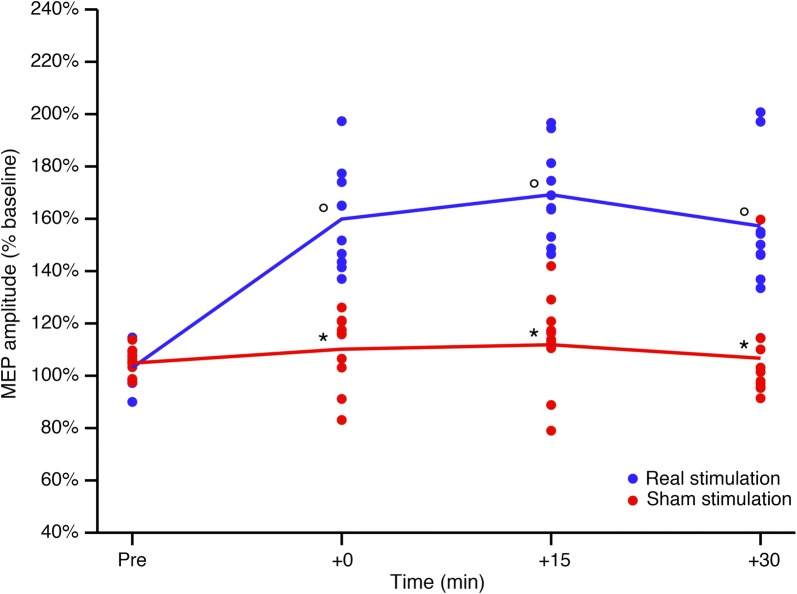
Fig. 2.
Corticospinal excitability after real and sham stimulation. Real and sham stimulation effects on corticospinal excitability, as measured by change in 1 mV MEP amplitude at various time points, in the real (blue line) and sham (red line) stimulation groups. Error bars represent standard errors. *p < 0.05 versus real stimulation. °p < 0.05 versus baseline (T0). MEP motor evoked potential, mV millivolt, min minutes

