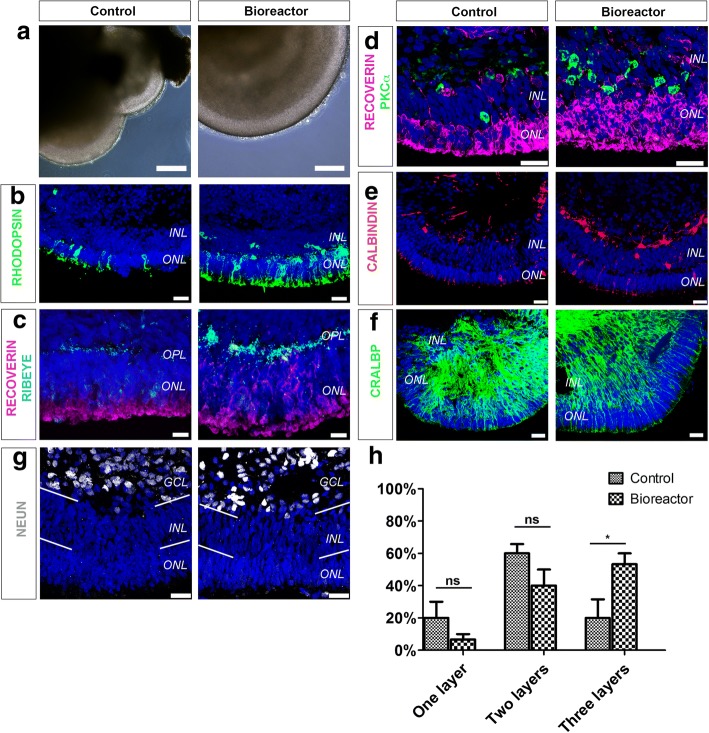
Fig. 3.
Characterisation of neuroepithelia lamination. a–f Phase-contrast images (a) and immunohistochemical analysis (b–f) of week 16 hPSC-derived retinal organoids grown in bioreactors and in control conditions. RHODOPSIN-positive (b) and RECOVERIN-positive photoreceptors in ONL and RIBEYE-positive ribbon synapses in OPL (c). PKCα-positive rod bipolar cells (d) and CALBINDIN-positive amacrine and horizontal interneurons in INL (e). CRALBP-positive Müller glia cells also present in both culture conditions (f). g Presence of NEUN-positive RGCs and subset of amacrine cells. h Quantification of number of retinal layers in control and bioreactor retinal organoids following DAPI staining. n = 10 random regions of retinal neuroepithelia per independent experiment, N = 3 independent experiments. Error bars, mean ± SEM; ns, P > 0.05; *P < 0.05, two-way ANOVA. Scale bars: 25 μM (a, b, d–g), 10 μM (c). GCL ganglion cell layer, INL inner nuclear layer, ns not significant, ONL outer nuclear layer, OPL outer plexiform layer

