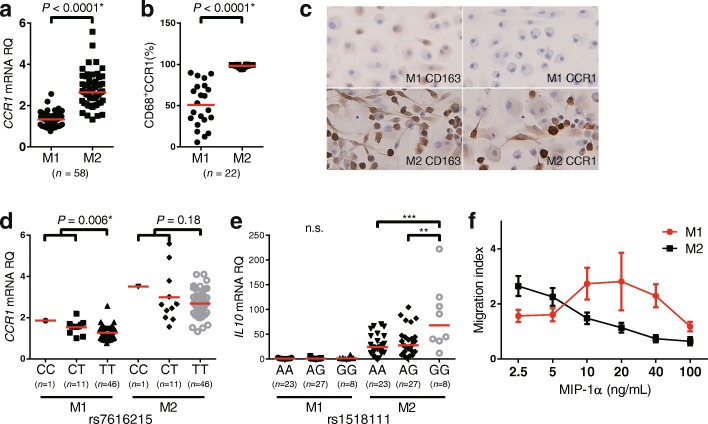
Fig. 1.
Comparison of M2 marker expression and function between M1 and M2 macrophages (Mφ) derived from healthy control subjects (HC). C-C chemokine receptor 1 (CCR1) messenger RNA (mRNA) and surface protein expression of M1 and M2 Mφ were detected using (a) real-time PCR and (b) flow cytometry, respectively. c IHC staining showing expression of CD163 and CCR1 in M1 and M2 Mφ (original magnification × 400). d CCR1 single-nucleotide polymorphism (SNP) rs7616215 genotype and expression of CCR1 mRNA and (e) IL10 SNP rs1518111 genotype and IL10 mRNA expression in M1 and M2 Mφ. f Chemotaxis of M1 (red) and M2 Mφ (black) toward macrophage inflammatory protein (MIP)-1α were determined by Transwell migration assay. The results are shown as the migration index. Red horizontal bars indicate median values. P values were determined by Student t test and one-way analysis of variance (**P < 0.01, ***P < 0.001). RQ Relative quantity

