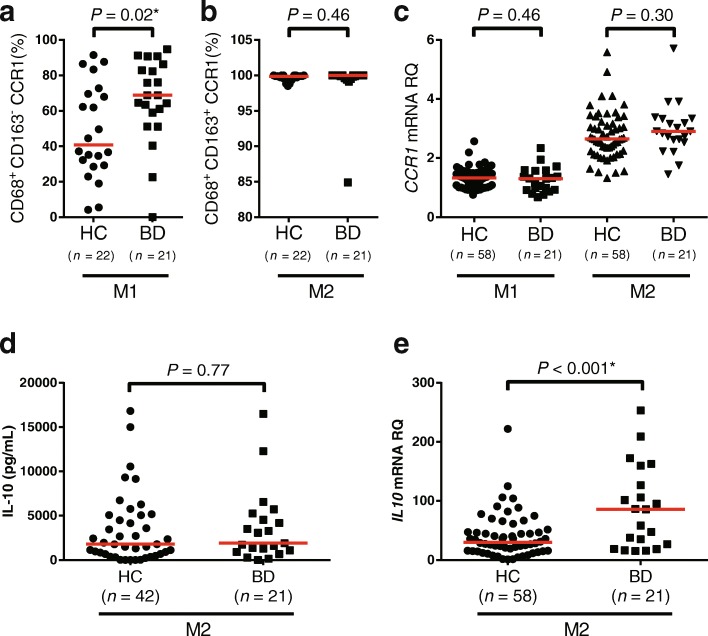
Fig. 2.
Comparison of C-C chemokine receptor 1 (CCR1) and interleukin (IL)-10 expression in macrophages (Mφ) derived from between healthy control subjects (HC) and patients with Behçet’s disease (BD). Flow cytometric analysis of CD68+CD163−CCR1+ (M1 Mφ) cells (a) and CD68+CD163+CCR1+ (M2 Mφ) cells (b) from HC and patients with BD. c CCR1 messenger RNA (mRNA) expression in M1 and M2 Mφ from HC and patients with BD. d Supernatant IL-10 concentration of lipopolysaccharide-stimulated Mφ from HC and patients with BD. e IL10 mRNA expression in M1 and M2 Mφ from HC and patients with BD. Red horizontal bars indicate median values. P values were determined by Student’s t test. RQ Relative quantity

