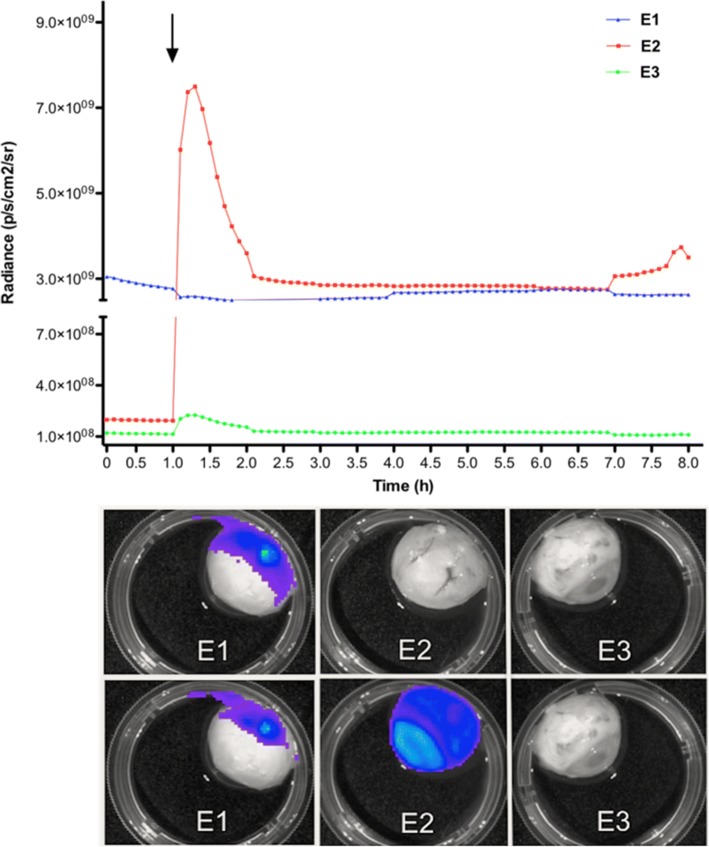
Fig. 1.
Bioluminescence results obtained from the three experimental eyes in the preliminary study. Top panel shows the distribution of the total amount of captured photons/second from the three eyes during the 8-h period. Bioluminescent levels were obtained from E1 (MSC + d-luciferin (40 mg/ml, 300 μl), E2 (MSC before and after injection of d-luciferin (40 mg/ml, 300 μl); black arrow), and E3 (d-luciferin (40 mg/ml, 300 μl)). Bottom panel shows bioluminescence imaging acquired at t = 0 h (first row) and t = 1.5 h (second row) after the additional injection of d-luciferin (40 mg/ml, 300 μl) performed in E2

