Fig. 4.
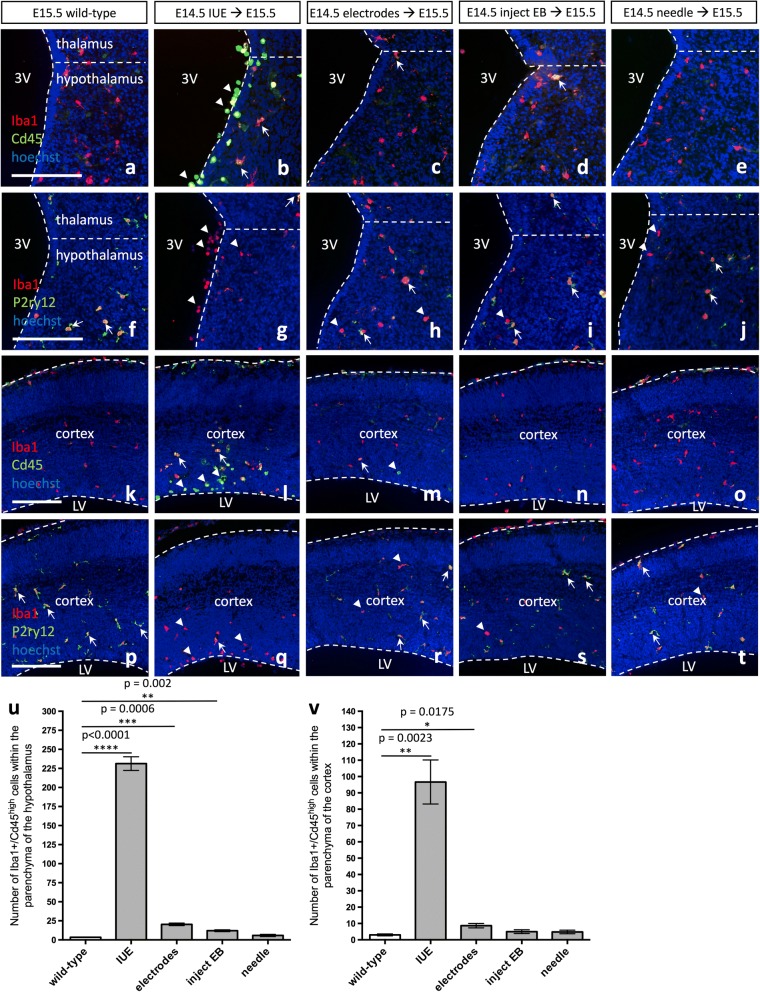
Foreign DNA is responsible for altering microglia morphology and expression signatures in the embryonic brain. Expression of Iba1 and Cd45 in a, k E15.5 wild-type, b, l E15.5 pCIG2 IUE (E14.5), c, m E15.5 brains electroporated with electrode paddles at E14.5, d, n E15.5 brains injected with elution buffer (EB) at E14.5, or e, o E15.5 brains stabbed with a sterile glass needle at E14.5. Expression of Iba1 and P2ry12 in f, p E15.5 wild-type, g, q E15.5 pCIG2 IUE (E14.5), h, r E15.5 brains electroporated with electrode paddles at E14.5, i, s E15.5 brains injected with EB at E14.5, or j, t E15.5 brains stabbed with a sterile glass needle at E14.5. Hypothalamus (a–j) and cortex (k–t). 3V, third ventricle; LV, lateral ventricle. Dashed lines outline the ventricles and mark the division between the thalamus and hypothalamus. White arrows mark Iba1+/Cd45high double-positive (b–d, l–m), or Iba1+/P2ry12+ double-positive (f–j, p–t) cells, while white arrowheads mark Cd45high single-positive (b, l–m), or Iba1+ single-positive (g–j, q–t) cells. Scale bar represents 250 μm (a–t). u Quantification of Iba1+/Cd45high cells within the parenchyma of the hypothalamus in wild-type brains as compared to IUE brains and the other treatments (mean ± SEM; wild-type n = 3; IUE n = 3, p < 0.0001; electrodes n = 3, p = 0.0006; inject EB n = 3, p = 0.002; needle n = 4, p = 0.2194). v Quantification of Iba1+/Cd45high cells within the parenchyma of the cortex in wild-type brains as compared to IUE brains and the other treatments (mean ± SEM; wild-type n = 3; IUE n = 3, p = 0.0023; electrodes n = 3, p = 0.0175; inject EB n = 3, p = 0.1963; needle n = 4, p = 0.2660)

