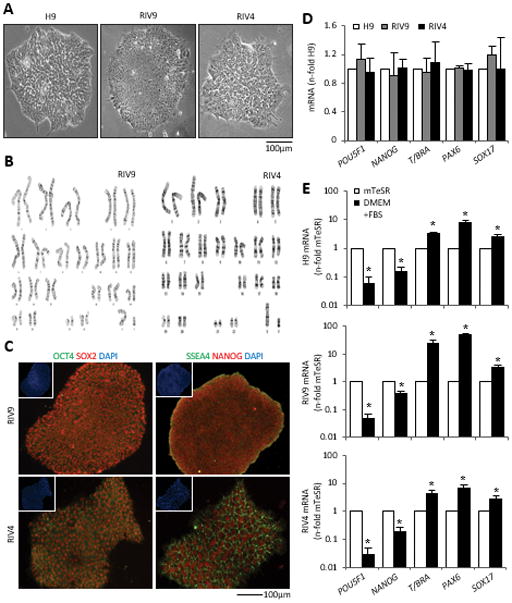
Figure 1. Cytogenetic, pluripotent, and genetic characterization of hiPSC lines.

(A) Morphology of H9 hESCs and RIV9 and RIV4 hiPSCs.
(B) Cytogenetic G-banding analysis for RIV9 and RIV4 hiPSCs (46, XY).
(C) Immunofluorescence staining for pluripotent markers. Insets, Nuclear counterstaining with DAPI.
(D) qPCR for mRNA expression of pluripotency and lineage markers on undifferentiated hPSCs. Expression is normalized to H9 hESCs and standardized to GAPDH, n=3 independent samples ± SD.
(E–G) qPCR mRNA expression of the same set of mRNAs on differentiating hPSCs, normalized to GAPDH, n=3 independent samples ± SD. *P<0.05, Student’s t-test compared to expression in undifferentiated cells (mTeSR).
T/BRA, T-Brachyury; GAPDH, glyceraldehyde 3-phosphate dehydrogenase.
