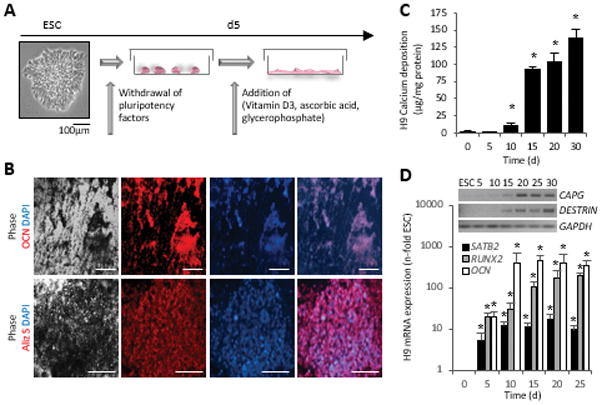
Figure 2. Osteogenic differentiation of hESCs.

(A) Schematic of the osteogenic induction protocol.
(B) Immunostaining with an osteocalcin antibody reveals presence of bone matrix in the vicinity of black deposits. Alizarin Red S staining detected calcium ions in the same areas. Scale bars = 100 μm.
(C) Quantitative measurement of deposited calcium over time, n=5 independent replicates ± SD, *P<0.05 Student’s t test compared to d0.
(D) Quantitative mRNA analysis of RUNX2, SATB2 and OCN, normalized to GAPDH (n=3 independent samples ± SD), *P<0.05 One-Way ANOVA over day 0. Triplicates were pooled for RT-PCR analyses of the osteocyte genes CAPG and DESTRIN (inset).
OCN, osteocalcin; Aliz S, Alizarin Red S; GAPDH, glyceraldehyde 3-phosphate dehydrogenase.
