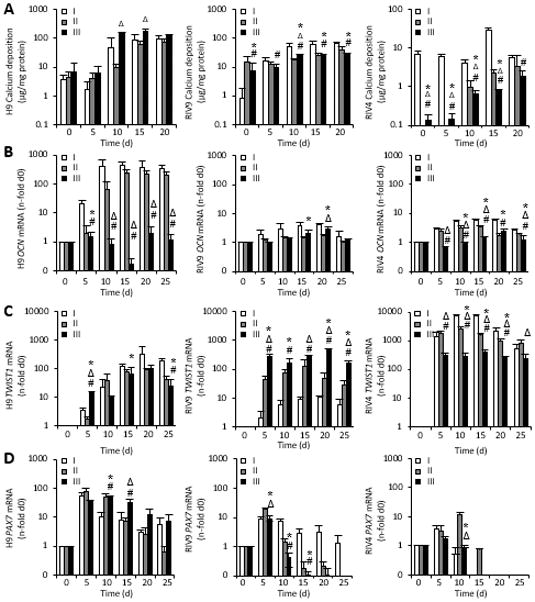
Figure 5. Passage-specific analysis of bone parameters and gene expression.

(A). Calcium content in hPSC cultures inoculated from three different passages (I–III). Data points represent 5 technical replicates for each biological passage shown ± SD. *P<0.05 passage II over I; #P<0.05 passage III over I; ΔP<0.05 passage III over II.
(B–D) The mRNA expression of osteogenic genes was determined with qPCR and normalized to GAPDH, n=3±SD. RIV9 and RIV4 hiPSCs failed to show definitive osteogenic patterns. *P<0.05 passage II over I; #P<0.05 passage III over I; ΔP<0.05 passage III over II, One-way ANOVA.
OCN, osteocalcin; GAPDH, glyceraldehyde 3-phosphate dehydrogenase.
