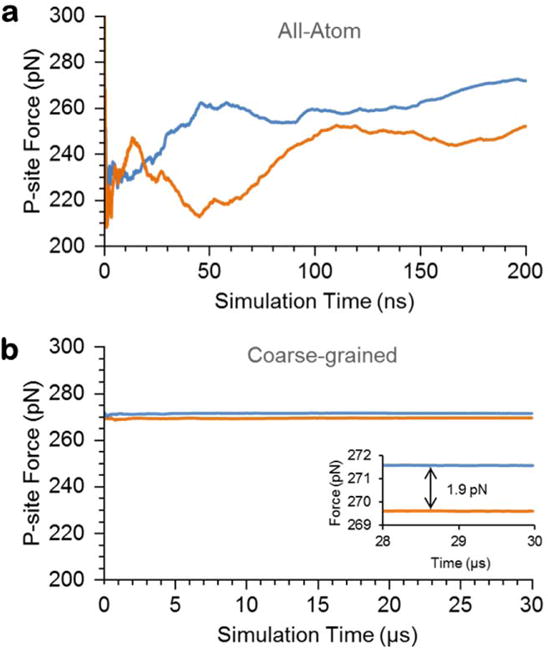
Figure 3. Self-averaging plots of the magnitude of the force experienced at the P-site residue versus time indicate that the all-atom simulations do not achieve equilibrium, while the coarse-grained simulations do.

(a) Force experienced at the P-site residue for the 3Ala10 RNC with the reporter cysteine restrained to either 92 Å (blue curve; arising from the 190-residue-long nascent chain) or 86 Å (orange curve; arising from the 95-residue-long nascent chain) from the P-site residue. The force was computed from Eq. 2. (b) Same as (a) except for the coarse-grained simulation of the 3Ala10 RNC. Inset shows the force difference (Eq. 3) is 1.9 pN.
