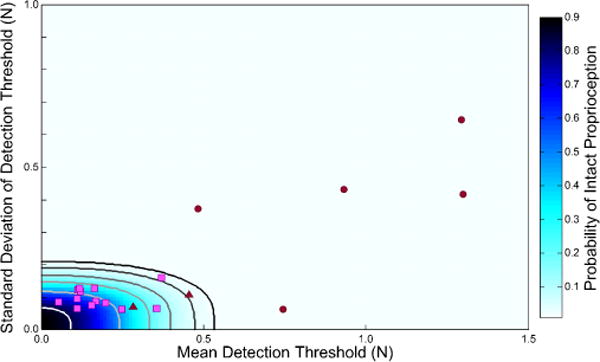
Figure 3.

Relationship between mean detection threshold (μf, x-axis) and variability of the detection threshold (σf, y-axis). NI control subject data (pink squares) were used to determine confidence interval bounds for intact proprioception (contours). The 99.9% CI bound is shown in black. Five SS(−) (maroon circles) had a combination of thresholds and variability that put them outside the bounds of the 99.9 % CI. Two SS(+) had a combination of thresholds and variability that put them inside the 99.9 % CI (maroon triangles).
