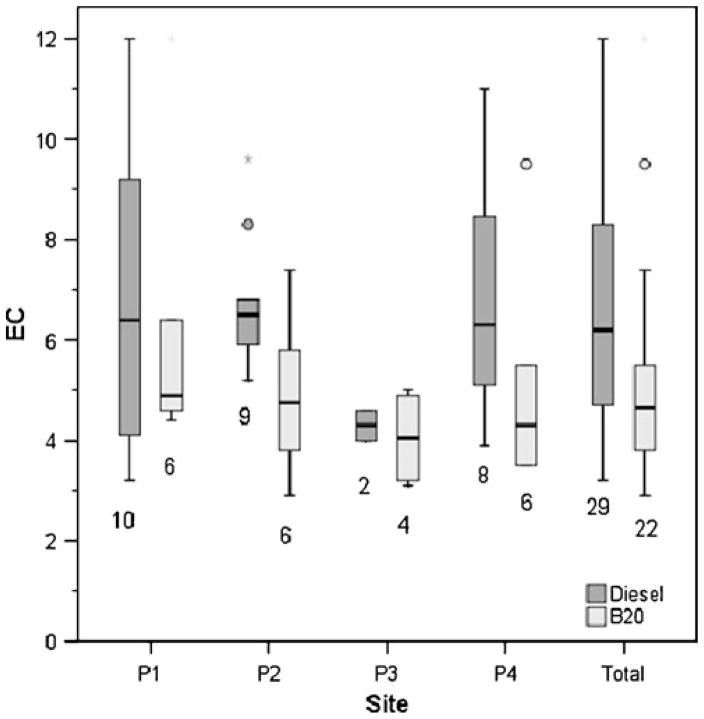
Fig. 4.
Comparison of diesel and B20 elemental carbon (EC) concentrations (measured in micrograms per cubic meter) at each location and summarized for the total site. The number below each boxplot denotes the number of sampling periods. The line in the center of each box represents the median value. Hollow circles denote “outliers,” defined as values that are between 1.5 and 3 times the interquartile range. Asterisks denote “extreme values,” defined as values that are more than 3 times the interquartile range. Transition days (B0–B10) were included as diesel days in this comparison

