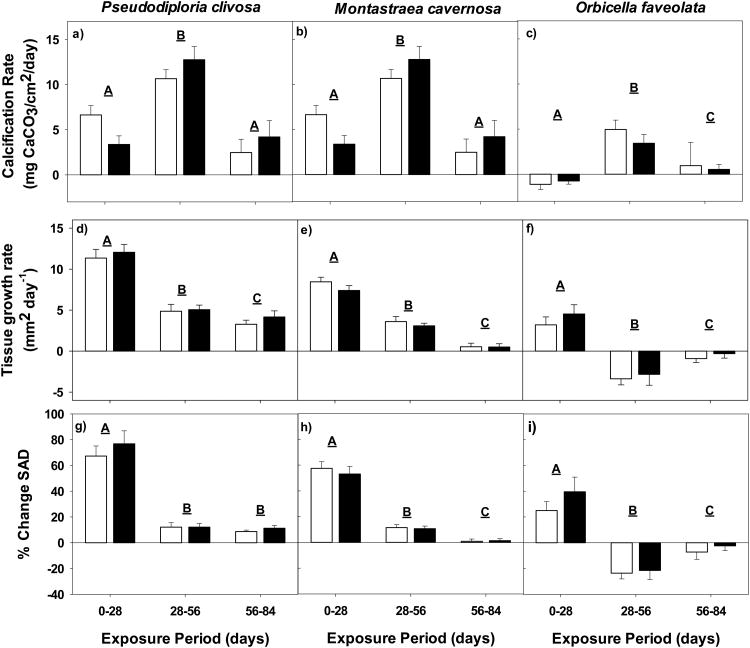
Fig. 3.
Average calcification rate (mg CaCO3/cm2/day), tissue growth rate (mm2/day) and percent change in surface area density of Pseudodiploria clivosa (panels a, d and g, respectively), Montastraea cavernosa (panels b, e, and h, respectively), and Orbicella faveolata (panels c, f and i, respectively) exposed to control pCO2 (white bars; ∼500 μatm), or elevated pCO2 (black bars; ∼1000 μatm) for periods of 0-28, 28-56, and 56-84 days. All errors are reported as average ± SE, with letters indicating significance of each exposure period.

