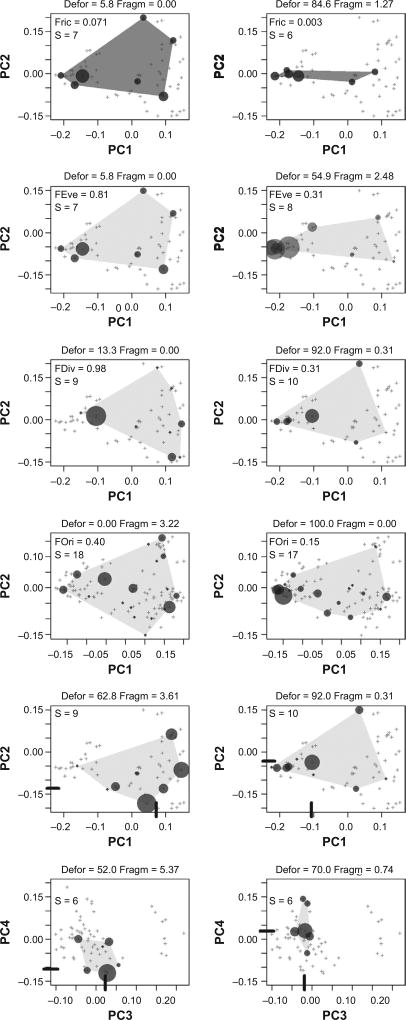
Figure 4.
Contrasting patterns of occupation of the functional space by different stream fish assemblages from the Amazon. Each plot represents two axes of a principal coordinate analysis (PC), where species are plotted according to their respective trait values. Gray crosses indicate all species from the regional pool (67 for Santarem or 112 for Paragominas), whereas dark-gray dots indicate the species present within a given local assemblage (delimited by the convex gray polygon); dot sizes are proportional to species abundances in that assemblage. The top four pairs of plots illustrate cases of high (left) and low (right) values for each index of functional diversity: functional richness (FRic), evenness (FEve), divergence (FDiv), and originality (FOri). The two pairs of plots on the bottom of the figure illustrate assemblages with contrasting values of functional identity (CWM indicated by black bars along each PC axis). For each case considered, the percentage of local deforestation (Defor) and the level of downstream fragmentation (Fragm) are indicated above the plot, as those are the most important land use predictors affecting the functional structure of the assemblages. S: number of species in the local assemblage.

