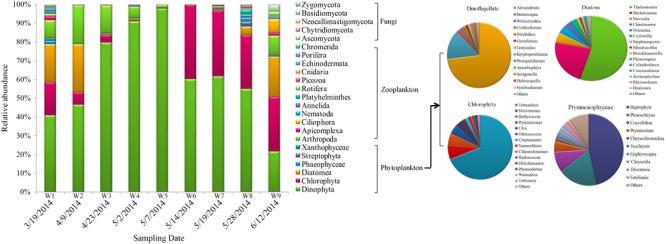
FIGURE 6.

Eukaryotic community composition in samples. Relative abundances of the dominant groups at the phylum level. The right panel shows the composition of primary phytoplankton groups, including Dinoflagellata, Chlorophyta, diatoms, and Prymnesiophyceae.
