
Fig. 3.
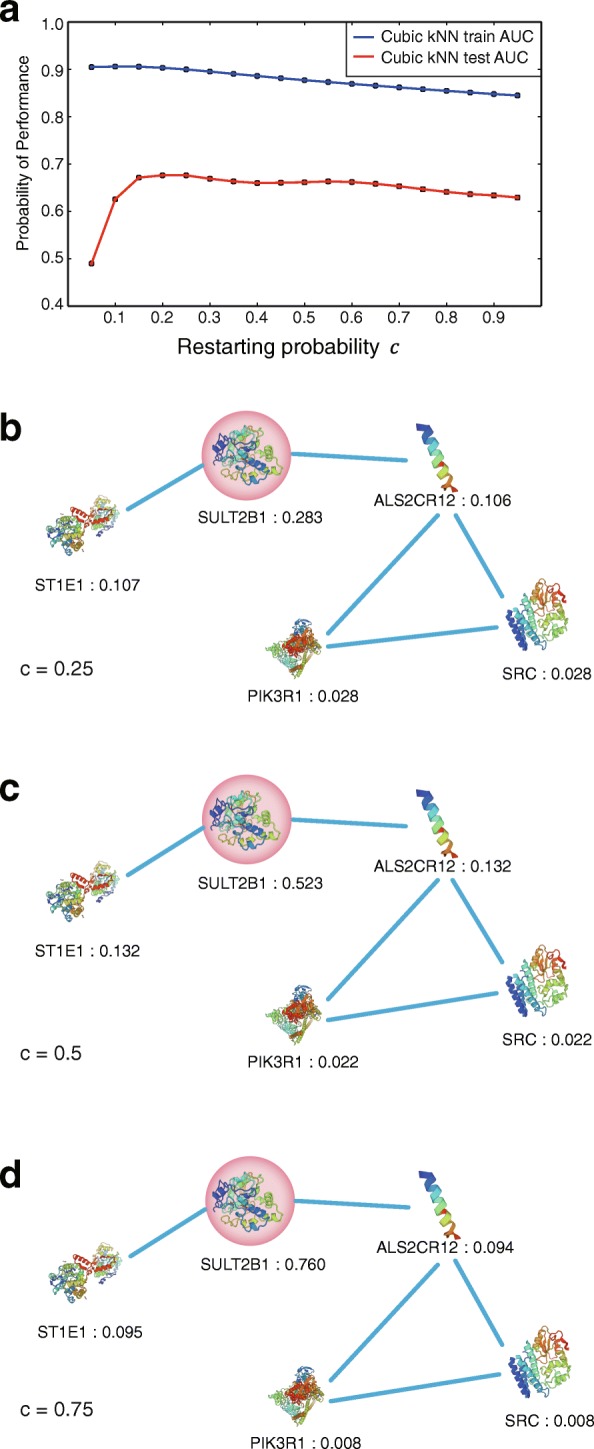
Prediction performances against to the restarting probability c and examples of affinity scores with respect to c. Performances of our model differ from restarting probability c and with different restarting probability c affinity score of neighbor nodes changes. a AUC scores from the independent dataset along the restart probability c. Results of the affinity scores of the proteins for the restart probability 0.25, 0.5, and 0.75 in subpanel (b, c, and d), respectively