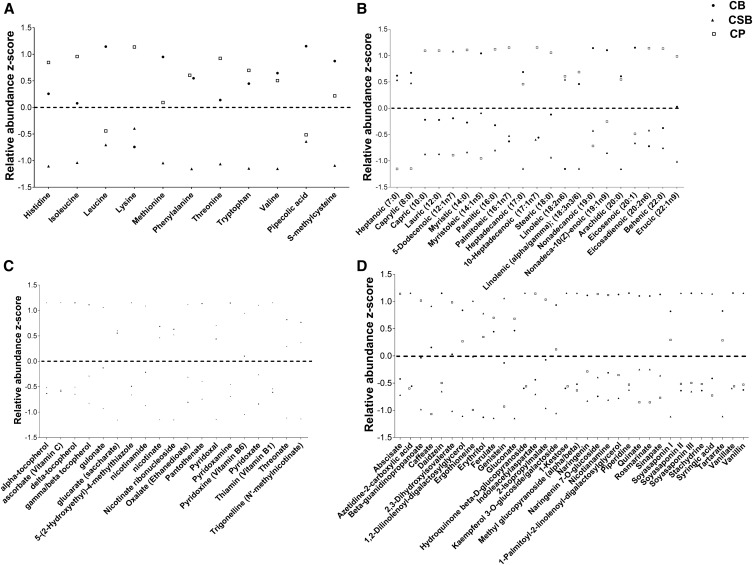
FIGURE 2.
Relative abundance z score distributions of selected metabolites detected in all 3 legume foods to visualize the distinct profiles. These include essential amino acids and common nonprotein nitrogen components in the amino acid pathway (A), FAs in the lipid pathway (B), the cofactors and vitamins pathway (C), and phytochemicals in the xenobiotic pathway (D). Dotted lines represent a relative abundance z score of 0. CB, common bean; CP, cowpea; CSB, corn-soybean blend.

