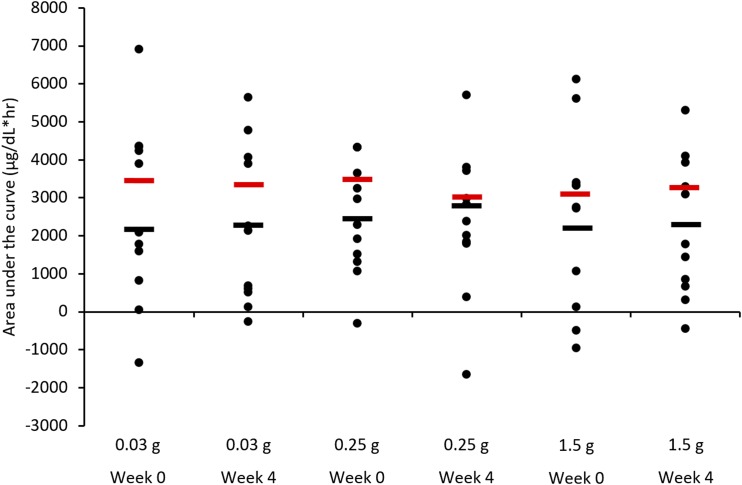
FIGURE 4.
Individual-level incremental AUC for serum iron at weeks 0 and 4 of each supplementation period. Mean regression-adjusted values for C-reactive protein, basic proline-rich protein, total salivary protein, meat consumption, and rating of highest level of astringency are shown in red, whereas unadjusted values are shown in black. There were no significant differences (P > 0.05) in iron absorption within the tannin supplementation periods.

