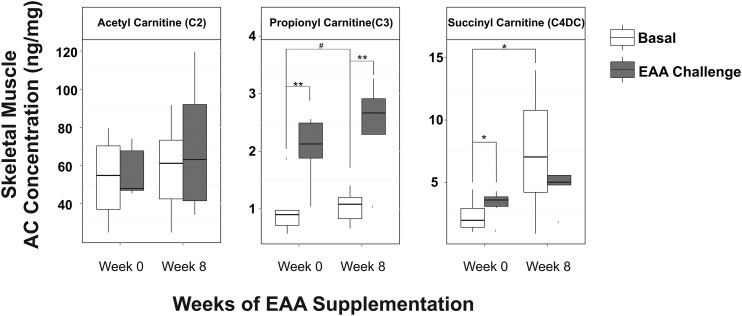
FIGURE 4.
Box plots showing skeletal muscle AC concentrations before (white boxes) and after (dark-gray boxes) acute EAAs + arginine intake at weeks 0 and 8 of daily EAAs + arginine supplementation; n = 6. ACs shown are intermediates of EAA oxidative metabolism. Solid horizontal lines within the boxes represent the median values. #P < 0.06, *P < 0.05, and **P < 0.01 (paired t test). AC, acylcarnitine; EAA, essential amino acid.

