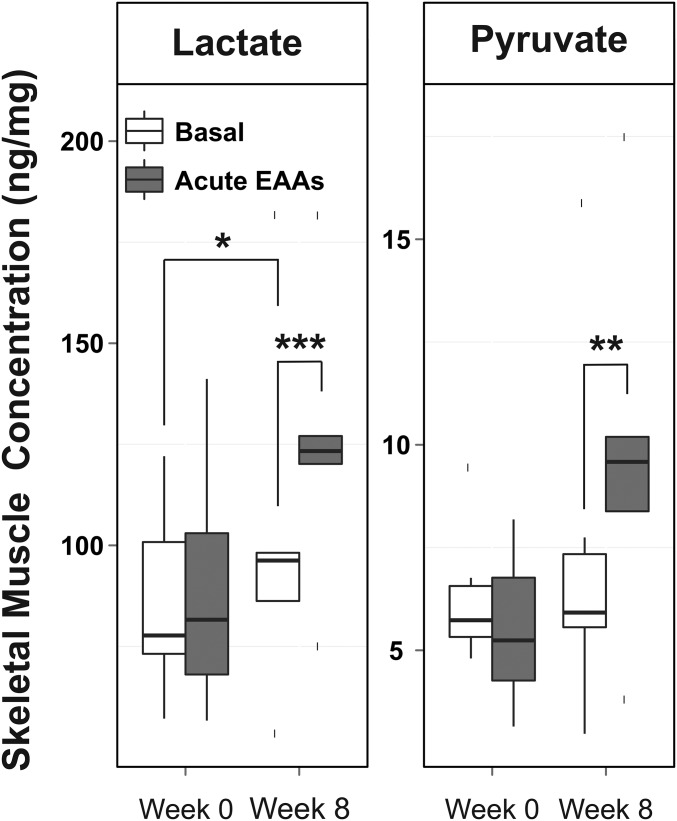
FIGURE 7.
Skeletal muscle lactate and pyruvate concentrations in response to acute EAA intake before (week 0) and after (week 8) chronic EAA supplementation; n = 6. Solid horizontal lines within the boxes represent the median values. *P < 0.05, **P < 0.01, and ***P < 0.001 (paired t test). EAA, essential amino acid.

