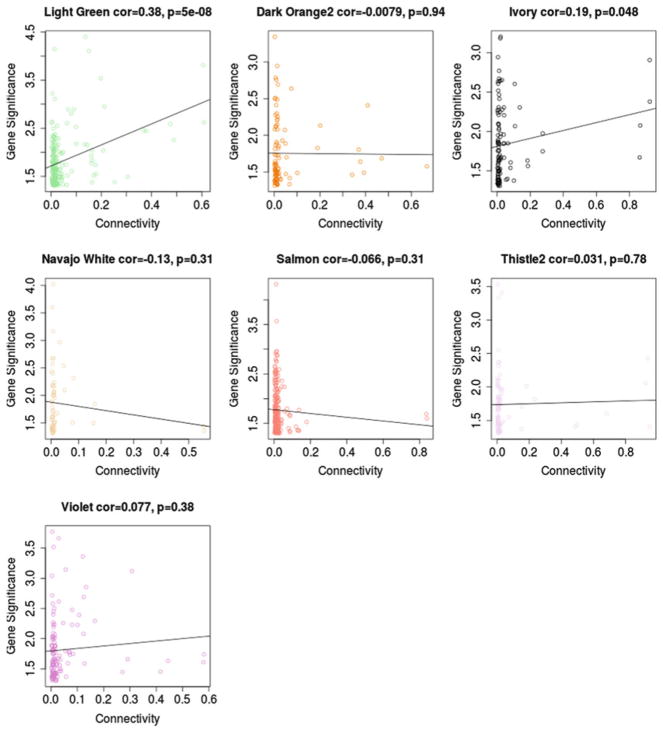
Fig. 3.
Module connectivity and significance in the GWAS. Within module connectivity for each SNP in the seven significant modules is plotted against significance of that SNP in the original GWAS. Overall, we find a moderately strong correlation between connectivity and significance among SNPs in the light green module, suggesting that hub SNPs in this module tended to be those that had more significant relationships to height in our training sample

