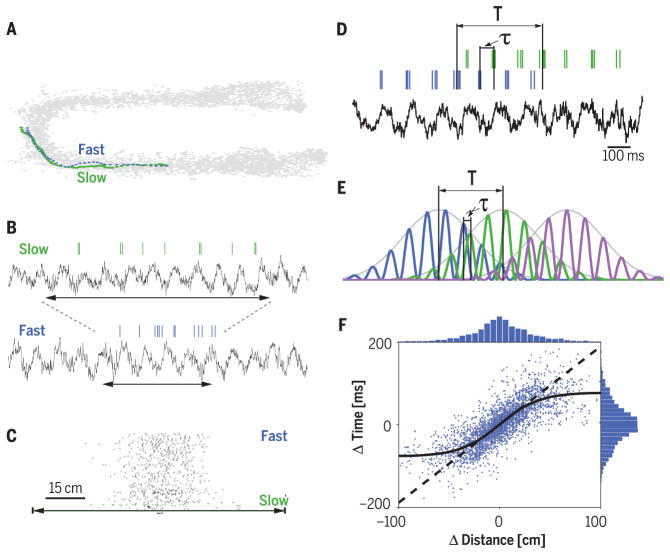
Fig. 2. Displacement-duration conversion by velocity in the hippocampus.
(A) Trajectories of a rat through a place field on two trials with different speeds. (B) Spikes of one place cell and the corresponding local field potential (LFP) theta rhythm of the same two trials as in (A). Horizontal arrows indicate the time it took for the rat to run through the place field. (C) The number of spikes within the neuron’s place field is similar on slow- and fast-run trials. Trials are sorted by velocity. (D) Spiking activity of two place cells (blue and green ticks) and LFP theta rhythm in a single run. Temporal duration (T) is the time needed for the rat to run the distance between the peaks of the two place fields (behavioral time scale). τ, time offset between the two neurons within the theta cycle (theta time scale). (E) Three idealized place cells with identical theta oscillation frequency, illustrating the relationship between T and τ. (F) Correlation between the distances of place field peaks and theta time scale lags (τ) for many pairs of neurons. Solid curve, sigmoid fit to the values; dashed line, line of equity. Above and right: histograms of distance and time lag, respectively. Modified from (34).

