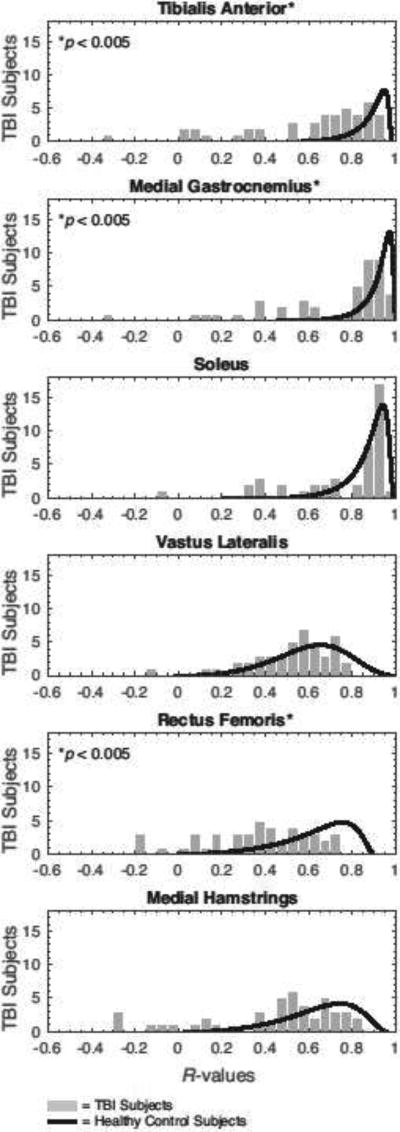
Figure 4.
Distributions of the muscle cross-correlations (R-values) for the TBI group compared with those of the healthy controls. Pearson cross-correlations were determined from treadmill walking data, and averaged between the left and right leg. Mann–Whitney U tests identified significant intergroup differences in the correlations exhibited by the tibialis anterior, medial gastrocnemius, and rectus femoris muscles (p<0.05). Similar distribution patterns were observed during overground walking.

