
Fig. 5.
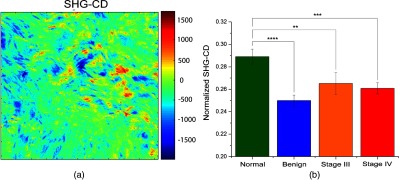
SHG-CD responses for the four ovarian tissue classifications. (a) Representative pixel map of SHG-CD for a stage III high-grade tissue and (b) normalized extracted SHG responses. ** indicates , *** = .
Official websites use .gov
A
.gov website belongs to an official
government organization in the United States.
Secure .gov websites use HTTPS
A lock (
) or https:// means you've safely
connected to the .gov website. Share sensitive
information only on official, secure websites.
SHG-CD responses for the four ovarian tissue classifications. (a) Representative pixel map of SHG-CD for a stage III high-grade tissue and (b) normalized extracted SHG responses. ** indicates , *** = .