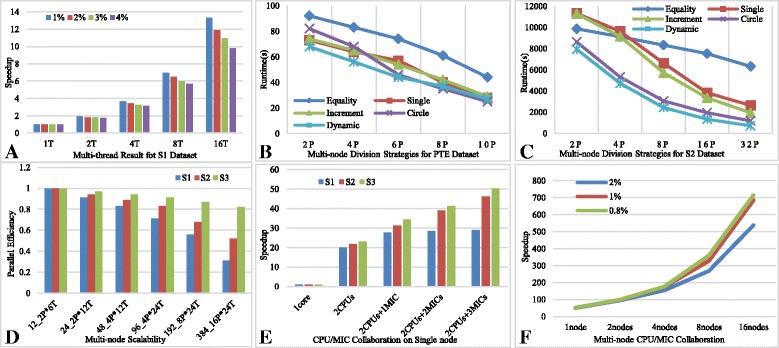
Fig. 7.

Experiments of parallel optimization. There are six pictures labeled as a,b,c,d,e and f respectively. The “T” in coordinate axis means the number of thread we have started. The “P” in coordinate axis means the number of process we have started. The “1Core” means we have only started one process with single thread to carry out these experiments. The “2CPUs” means we have started one process with 24 threads to carry out these experiments. This is because there are two CPUs with 12 cores on single node of Tianhe-2 supercomputer
