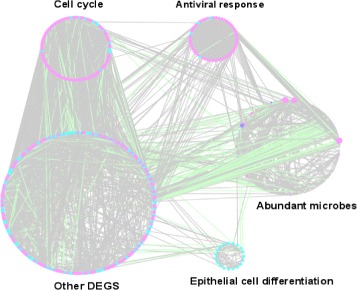
Fig. 4.

An illustration of the host-microbial network. Nodes refer to differentially expressed genes (DEGs) or abundant microbes, edges the regulation relationship between DEGs and microbes. Nodes in pink are up regulated, and these in cyan are down regulated. Edges in grey are positively correlated, and these in green are negatively correlated
