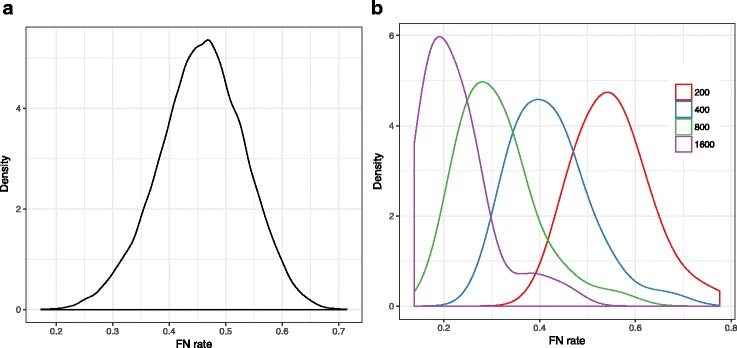
Fig. 1.

Properties of the S100 dataset. a The density plot of the amount of true gene discordance measured by the FN rate between the true species tree and the true gene trees. b The density plot of gene tree estimation error measured by FN rate between true gene trees and estimated gene trees for different sets of sequence lengths
