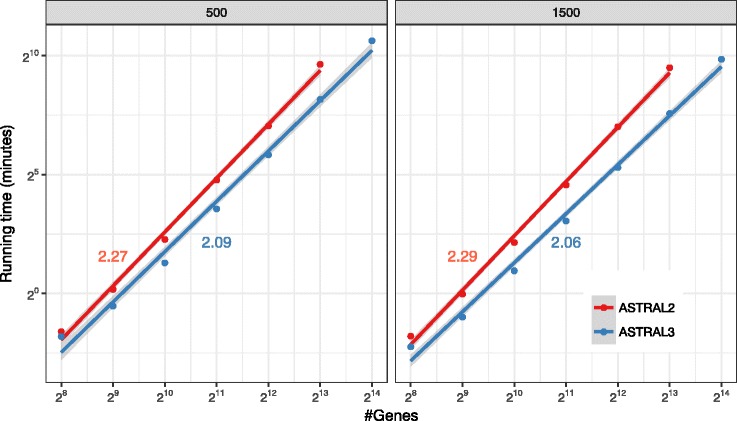
Fig. 5.

Running time versus k. Average running times (4 replicates) are shown for ASTRAL-II and ASTRAL-III on the avian dataset with 500bp or 1500bp alignments with varying numbers of gens (k), shown in log scale (see Additional file 1: Figure S2 for normal scale). A line is fit to the data points in the log/log space and line slopes are shown. ASTRAL-II did not finish on 214 genes in 48 hours
