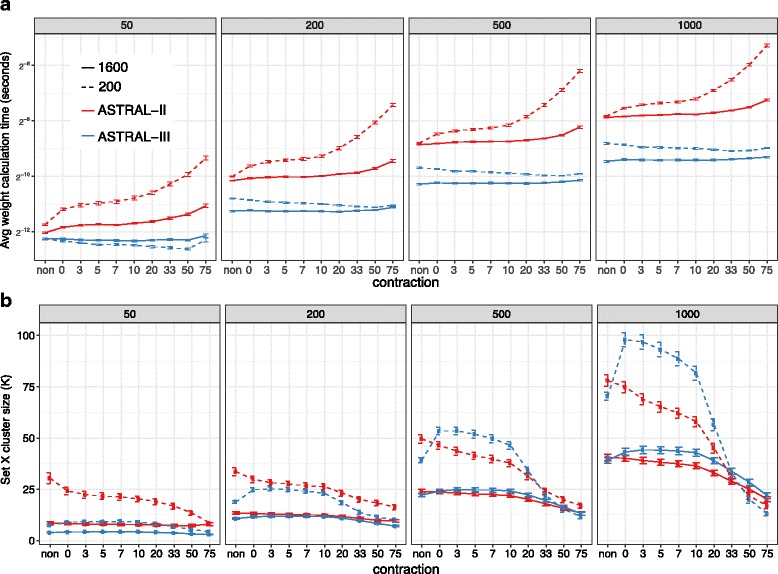
Fig. 6.

Weight calculation and |X| on S100. Average and standard error of (a) the time it takes to score a single tripartition using Eq. 3 and (b) search space size |X| are shown for both ASTRAL-II and ASTRAL-III on the S100 dataset. Running time is in log scale. We vary numbers of gene trees (boxes) and sequence length (200 and 1600). See Additional file 1: Figure S3 for similar patterns for with 400 and 800bp alignments
