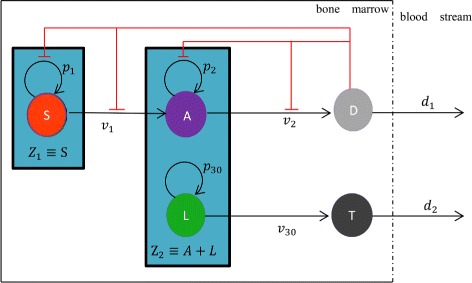
Fig. 1.

Schematic diagram of leukemogenesis and haematopoietic stem cell lineages. Upper row: haematopoietic linage. Lower row: leukaemia linage. The flat-head arrows extending from terminally differentiated cell (D) with red color indicates feedback inhibition to self-renewal of S and A (colour online)
