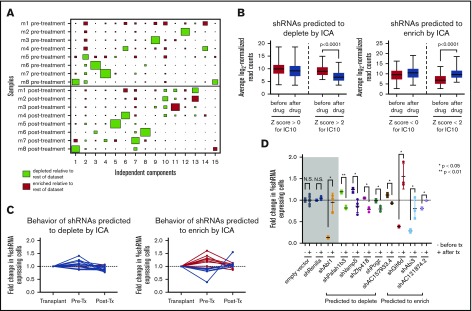
Figure 2.
ICA of in vivo RNAi screening data identifies a set of hairpins with distinct behavior after therapy. (A) A Hinton plot of the independent components generated by ICA shows the signature generated by each component across all in vivo samples before and after dasatinib treatment. Colors represent directionality of hairpin representation (red enriched, green depleted) defined by that component and the size of each rectangle quantifies the strength of the signature for that component (column) in a given sample (row). Each component identifies a 2-sided signature, such that there are enriched and depleted hairpins within each sample for each signature; only 1 side of the component is depicted here. IC10 identifies a signature of hairpins that have distinct representation before and after therapy (P = .0078, Mann-Whitney U test). (B) Box-and-whisper plots showing the normalized representation before and after therapy from the original RNAi screen of those shRNAs predicted to deplete (left) or enrich (right) after therapy by IC10. Hairpins with a Z score <−2 or >2 are considered significant by this analysis. (C) Graphs showing normalized hairpin representation over time from individual GFP competition assays of 16 shRNAs predicted by IC10 to deplete after therapy (left) and 13 shRNAs predicted by IC10 to enrich after therapy (right). Blue lines denote shRNAs that behave as predicted by IC10; red lines denote shRNAs that do not behave as predicted. (D) Scatterplots showing normalized fold change of shRNA-expressing cells before and after dasatinib treatment in vivo in GFP competition assays of a set of 16 shRNAs that are predicted to deplete or enrich after therapy by IC10 and have at least a 1.5-fold difference in representation after therapy as compared with before. − denotes the fold change is before therapy (pre/input); + signifies fold change after therapy (post/pre). Controls are in the gray box: an empty hairpin vector and a hairpin targeting Renilla luciferase, which these cells do not express, are negative controls expected to lack significant change in representation, and a hairpin targeting ABL1 is included as a positive control that is expected to behave significantly differently after therapy vs before. Fold changes are normalized to an empty vector or a hairpin targeting Renilla luciferase. At least 3 mice were used per hairpin. Error bars represent standard deviation; P values were calculated using the Student t test. N.S., not significant.

