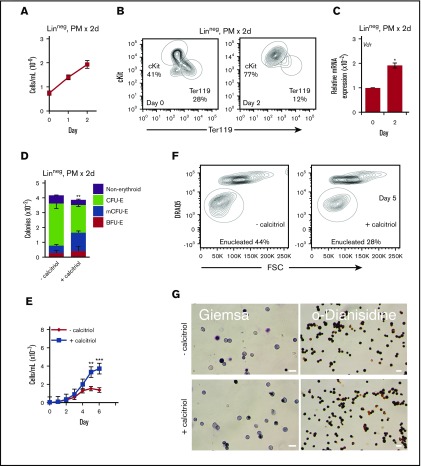
Figure 2.
Activation of Vdr delays maturation of EryD progenitors. (A) Proliferation of E12.5 Linneg FL cells cultured for 2 days under progenitor conditions (in PM; n = 3). (B) Representative flow cytometry analysis of cKit and Ter119 expression for E12.5 FL Linneg cells after 2 days of culture in PM (n = 3). (In contrast with the starting population of FL cells, the Ter119+ cells that remained after lineage depletion showed only very weak Ter119 fluorescence.) (C) Real-time RT-PCR analysis of Vdr RNA (10 ng) from E12.5 FL Linneg cells after 2 days of culture in PM. Expression was normalized to Ubb. (D) Distribution of colonies formed from Linneg progenitors cultured for 2 days in PM and then transferred to methylcellulose (2.0 × 10³ cells in 1 mL, 35-mm dish) with or without calcitriol. The distribution of these colony types, but not their total numbers, was altered when Vdr signaling was activated, with increased numbers of earlier progenitors (BFU-E + mCFU-E, 40% vs 18%) and decreased numbers of the later progenitors (CFU-E, 45% vs 69%) (n = 3). (E) Proliferation of E12.5 Linneg cells cultured for 2 days in PM and then transferred to MM with or without calcitriol (n = 5). (F) Representative flow cytometry plots of DRAQ5 staining vs FSC of Ter119+ cells after 5 days of culture in MM, with or without calcitriol. (G) Wright-Giemsa or o-dianisidine staining of cytospun cells from day 6 of culture in MM. Scale bars, 20 μm. Data were analyzed using a 2-way analysis of variance (analysis of variance [ANOVA], E) or an unpaired Student t test (B-D,F; *P < .05, C; **P < .01, D-E; ***P < .001, E). Error bars, ± SEM (n = 3).

