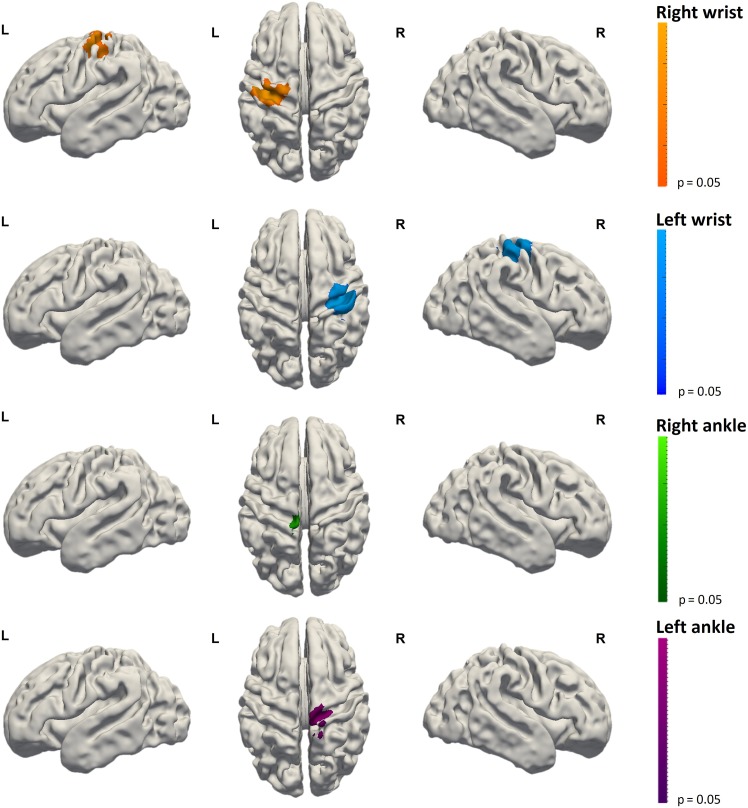
Figure 3.
Functional responses resulting from the group analysis following somatosensory stimulation of the left ankle (n = 10), left wrist (n = 10), right wrist (n = 10), and right ankle (n = 9). Well localized distinct clusters of activation can be seen within the contralateral sensorimotor cortex across the central sulcus. Images show the results of one-sample nonparametric t-tests (P < 0.05 corrected for family wise error) projected onto the gray-white matter boundary of a 34 week PMA template brain.

