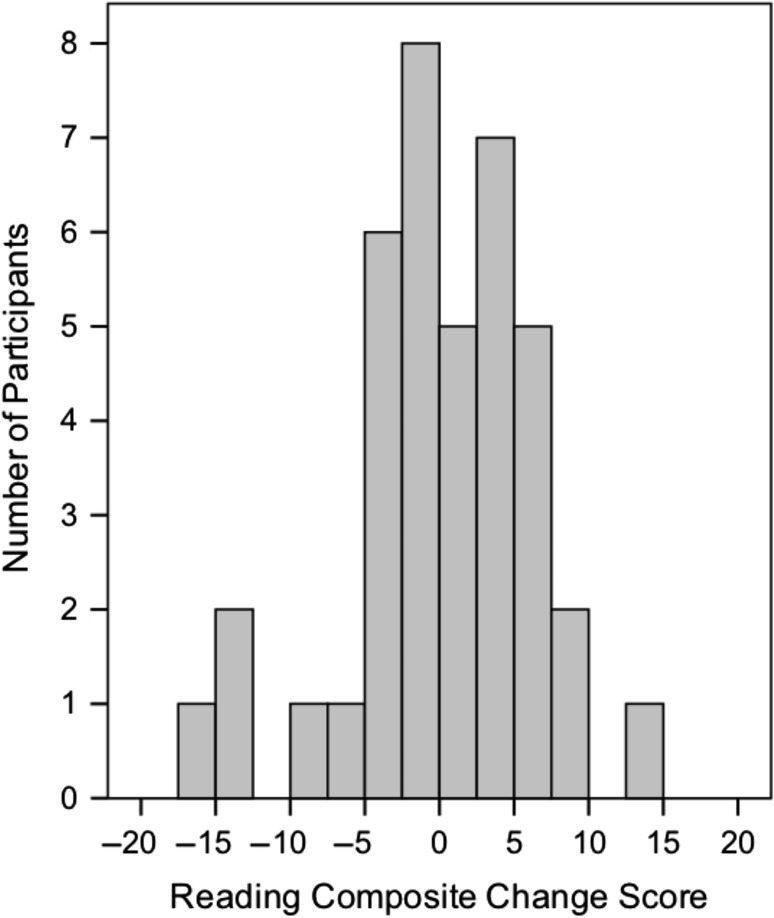
Figure 4.
Histogram of pre-to-post changes in the composite reading score for all participants in the intervention group only (n = 39). Positive scores indicate a score increase and classification as an intervention “Responder,” while negative scores indicate a score decrease and classification as an intervention “Nonresponder.”

