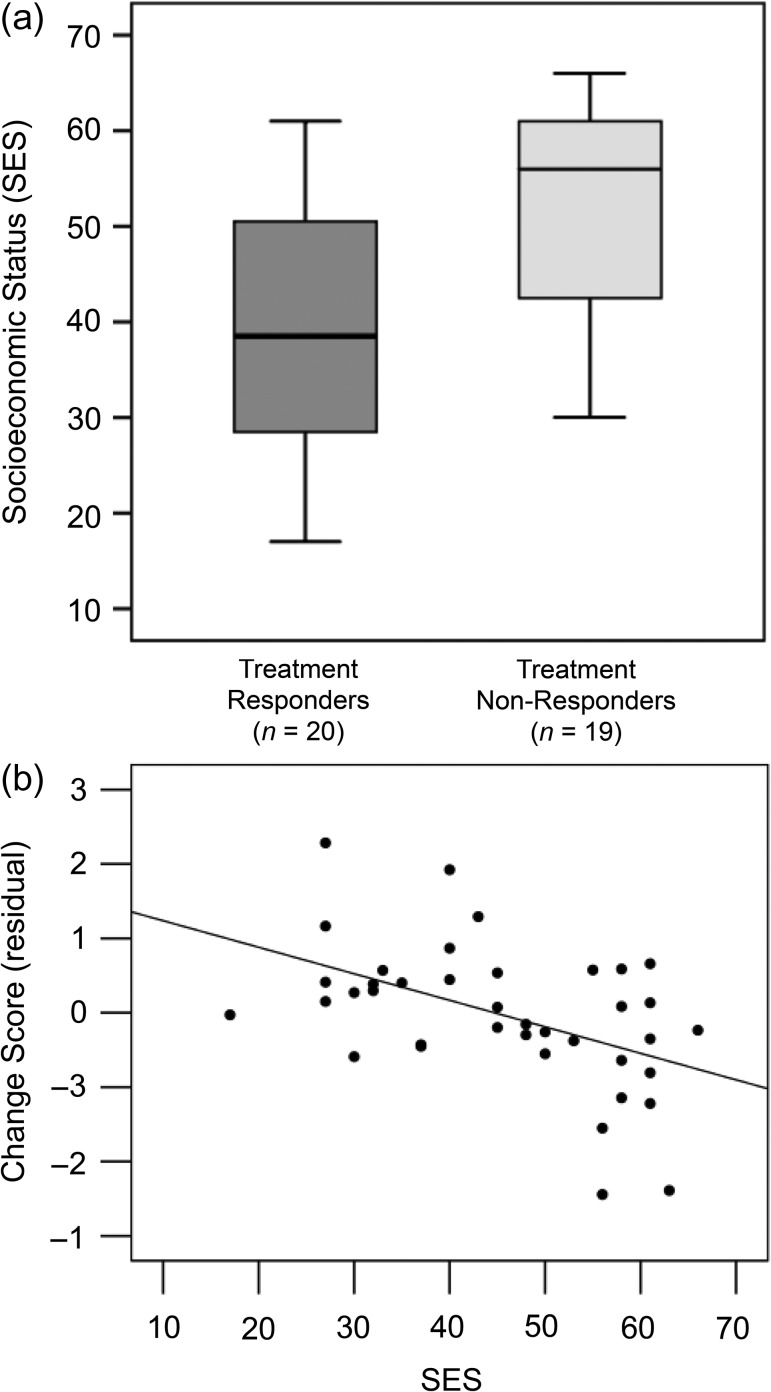
Figure 5.
Relation between SES and response to treatment. (a) Boxplot of SES as a factor of treatment response. Intervention response (improvement) was operationalized as a positive change score when averaging standard scores on 4 reading subtests: WRMT-3 Word Identification and Word Attack, and TOWRE-2 Sight Word Efficiency and Phonemic Decoding Efficiency. (b) Partial residual plot showing the amount of improvement (change in composite reading score, controlled for baseline score) as a function of SES.

